Year 2 Use Data to Solve Maths Problems

4th May 2023
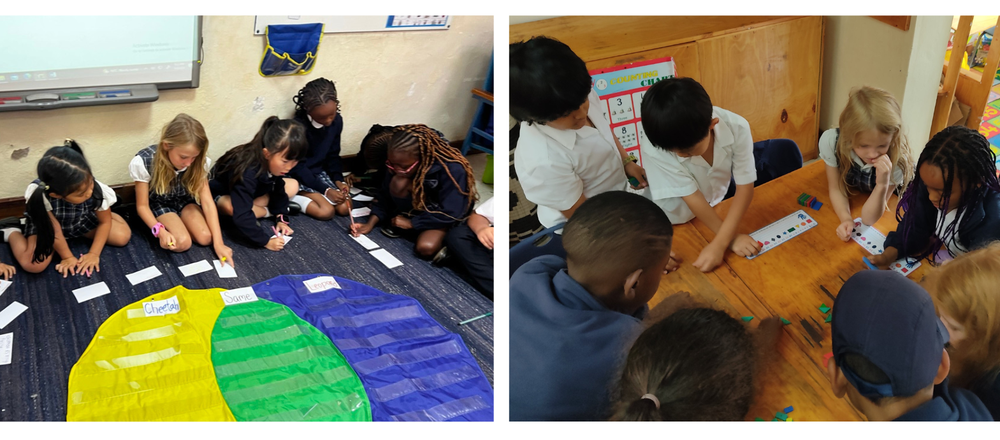
From May 2nd to 5th, Year 2 pupils learned about the different ways of sorting statistical data during mathematics lessons. The Year 2s started off the unit with learning how to differentiate between different types of objects by defining what they had in common with each other, be it their shape, size or colour. They then learnt how to represent this data using various methods, such as a tally chart and a Venn diagram.
It was great to see Year 2s stay focussed on their work, especially working well in group our paired work, and at the same time building strong relationships amongst themselves whilst developing their mathematical understanding. Well done Year 2!


